This is a slightly modified and sanitized version of a post that I wrote on my employer’s internal collaboration site. I’m sharing it here because I wasn’t able to find any clear guide to this exact process, and because I’ve been really bad at keeping up with my blog lately.
At work my team runs an internal instance of Artifactory, a binary artifact repository manager that stores and serves artifacts for multiple software packaging systems (we use it for Ruby Gems, Maven packages, NPM, PyPI and Docker images). Many teams within our company rely on this service in their build and deploy processes. Last week we suffered a severe degradation of Ruby Gem serving from our Artifactory instance. One of the other engineers on my team was able to identify and resolve the problem based on intuition and experience, but I’d like to walk through a process that I used to collect some detailed data for troubleshooting and confirmation of the cause.
Our Artifactory service runs in AWS as a HA cluster of three EC2 instances fronted by a classic Elastic Load Balancer (ELB), with a private address only so that it’s only available internally. Artifactory itself is a Java application running under Tomcat Catalina, with repository metadata stored in a MySQL RDS cluster and binary artifacts stored in S3. Artifacts are organized into repositories, with each repository containing a specific set of artifacts of a given type (i.e. Maven, gems, NPM, etc. In addition to storing and serving artifacts locally, Artifactory also has the capability to configure remote repositories that retrieve and cache artifacts from remote servers, and “virtual” repositories that combine two or more local or remote repositories into one unified view.
My first reaction was to begin with the high-level monitoring of the ELB provided by CloudWatch. While I’d expected to see various metrics (most likely HTTP 4xx or 5xx errors) far from their historical baseline, the only obvious deviations from normal were number of connections and backend request time (the time the actual Artifactory instances were taking to handle requests). While the rest of my team was also investigating, I attempted to start analyzing the Artifactory logs in our Splunk instance (our company’s official Enterprise Log Solution). Unfortunately, I quickly found that the logs were not very useful. First, the logs contained a high volume of noise: repeated and persistent errors present for a very long time, overly verbose logs for certain actions, and Java stack traces split across dozens or hundreds of separate log entries in Splunk. Second, and more importantly, Artifactory was logging requests as coming from the IP address of the load balancer instead of the actual client and was missing other key pieces of information such as the user-agent and time taken to serve the request. It seemed clear to me that these logs weren’t going to provide as much information as I’d hoped.
Luckily I found that we had ELB access logging enabled on the load balancer, sending access logs to S3 once an hour. Unfortunately, we weren’t doing anything with those logs and I don’t believe they had ever been referenced before; we certainly weren’t ingesting them into Splunk or any other centralized log store. But the ELB access log format contains all of the information I was looking for: timestamp with milliseconds, exact request URL, actual client IP address, user-agent, sizes of request and response, ELB and backend (Artifactory) HTTP status codes, and the time taken to process the request both by the backend and the ELB itself.
With the useful and relevant logs sitting in S3 and not being ingested to any analysis system, my first instinct was to use Amazon Athena, a tool to execute SQL-like queries directly against data in S3. The results were certainly better than anything else we had access to, but without the ability to graph elements of interest over time they did not prove to be helpful in determining what patterns had changed since the previous hours, days and weeks. After some thought, my next instinct was to turn to the Elasticsearch, Logstash, Kibana (ELK) stack that I’m familiar with from previous jobs.
Elasticsearch is a clustered full-text search service built atop Apache Lucene, Logstash is a log aggregator and shipper with flexible plugin-based inputs, outputs, pre-processing and filters, and Kibana a dynamic web interface for Elasticsearch geared towards search, analysis and graphing of time-series and log data. They’re all open source projects now developed and commercially supported by Elastic, and together they form what is likely the largest and strongest open-source alternative to Splunk. Amazon has a managed Elasticsearch Service that includes the Kibana web interface, so I knew that getting up and running would be quick and easy.
I was able to go from start to analyzing a months’ worth of ELB access logs in just over an hour, using the process described below (that time could’ve been greatly reduced if I changed some default Logstash configuration and didn’t read the logs from S3 one file at a time in serial). Fortunately one of the other engineers on my team was able to restore Artifactory service while I was going through this process, but I continued anyway in order to see what data we could obtain. Note that none of this would have been needed if we were properly ingesting the ELB access logs into a centralized analysis tool before the incident.
- Identify a suitable subnet in our VPC that has a NAT instance for outgoing Internet connectivity and a suitably high number of free IP addresses. Record the subnet ID.
- Amazon Elasticsearch and Kibana run over HTTPS on port 443, so identify or create appropriate security groups that allow you and your team to access port 443 (ideally, you access private resources in AWS over VPN or Direct Connect).
- Create a new Elasticsearch Domain (cluster) in AWS. Since I wasn’t terribly familiar with the service, I did this manually through the AWS Console. For short-lived ad-hoc analysis, leave most options at their default and create a single-instance cluster. Use General Purpose SSD storage; I provisioned storage at just under 10x the size of the months’ raw logs in S3. I set the access policy for Elasticsearch to the canned option to disable requiring IAM signatures on requests and control access only via the security group, so that any engineers with access to the account could use the Kibana UI. I then added the subnet I identified in the first step and the security groups identified in the previous step.
- It took about ten minutes for the Elasticsearch domain to become operational; until then, the AWS Console showed the domain to be in “Processing” status. During this time I spun up an EC2 instance to run Logstash on. I used the CentOS base AMI, but Amazon Linux would work just as well. I created the instance in the same subnet as the Elasticsearch cluster, added a security group allowing SSH access for our team, and attached an IAM Role allowing S3 access to retrieve the ELB logs.
- Once the EC2 instance was running and accessible over SSH, I installed Java 8 with
yum install java-1.8.0-openjdk-headlessand then followed the Logstash installation instructions for yum-based systems. - Create
/etc/logstash/conf.d/logstash.confas shown below. - Wait for the Elasticsearch domain to status to reach “Active”. Once that happens, you should see two URLs for the Domain: a “VPC endpoint” where the Elasticsearch API can be reached (mine was
https://vpc-jantman-art-elb-test2-ryomklmh5hr7pcmhw7jvx7t374.us-east-1.es.amazonaws.com) and a “Kibana” URL where the Kibana web interface is available (mine washttps://vpc-jantman-art-elb-test2-ryomklmh5hr7pcmhw7jvx7t374.us-east-1.es.amazonaws.com/_plugin/kibana/). - SSH to the EC2 instance and confirm connectivity to Elasticsearch via
curl, substituting in the VPC endpoint URL for your cluster:curl https://vpc-jantman-art-elb-test2-ryomklmh5hr7pcmhw7jvx7t374.us-east-1.es.amazonaws.com. If all is well, you should get back a JSON response that includes a name, cluster name, version, etc. If this doesn’t work, troubleshoot connectivity issues until it does. - Start the Logstash service with
sudo systemctl start logstashand then watch the initial logs withjournalctl -u logstash. It should shortly tell you that it is writing logs to/var/log/logstash. At this point you cansudo tail -f /var/log/logstash/logstash-plain.logto follow logstash’s progress. - If all went well, Logstash should tell you that it’s connected to elasticsearch (
New Elasticsearch output) and S3 (Registering s3 input), and then that it has successfully begun working (Pipeline started succesfully). On new installations you should see a message similar to[logstash.inputs.s3 ] Using default generated file for the sincedb, which indicates that the S3 input is starting to process files. - Browse to the Kibana URL found in the Elasticsearch console, above (step 7). Soon after Logstash begins ingesting data, Kibana should recognize the new indices and prompt you to create an Index Pattern for them (if the interface says that no indices could be found, wait a minute or two and then refresh). Since Logstash creates a separate index for each days’ data named according to a
logstash-YYYY.MM.DDpattern, enterlogstash-*for your index pattern and click “Next”. The “Time Filter field name” used by our Logstash configuration file istimestamp(not@timestamp), so select that from the dropdown and click “Create Index Pattern”. That’s it, Kibana is configured. - Click the “Discover” link on the left sidebar in the Kibana interface, and then click the clock icon in the far top right of the screen and select an appropriate time range for the data you’re ingesting (I selected the last 30 days, as I was ingesting ELB access logs for the current month). After a brief delay messages should be visible and the graph of messages will populate. Because of how ELB access logs are written to S3 and how Logstash ingests them, logs will be ingested in chronological order by day, so the graph by date is a good indication of ingest progress.
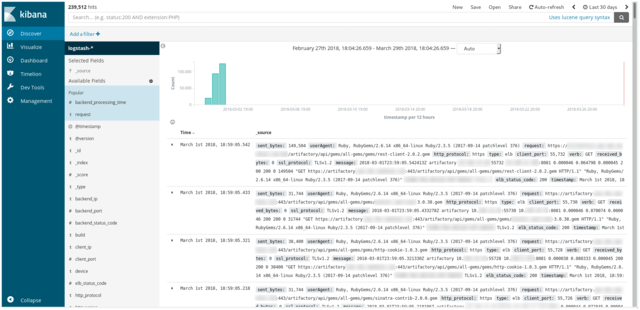
- When all data up to the current time is ingested you can either terminate the EC2 instance running Logstash, or keep it running. It will check S3 for new files every minute and keep ingesting them as long as Logstash is running. (Note: the Logstash configuration described here is only for ad-hoc analysis, not a long-running need.)
I’ll leave further discussion of how data can be analyzed and visualized to others; the Kibana User Guide does a great job of it and even links to some introductory videos, and there is much information on the Internet. I find the recent versions of Kibana to be one of the best interfaces I’ve ever seen for exploring complex log data, and it’s also designed with graphical visualizations as a first-class citizen with many helpful links.
For analysis of this particular issue I was focusing on “backend_processing_time”, the time it took Artifactory to handle requests. My first real dive into the data was graphing mean and 75th, 95th and 99th percentile processing times over all the data:
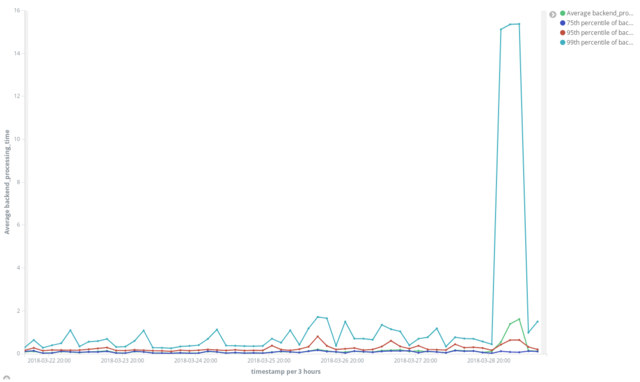
While there’s a large difference between the average and even 95th percentile versus the 99th throughout the data, the extreme jump in the 99th percentile value (about 16x the previous value and significantly more than the 95th) confirmed our findings that this was likely not a system-wide failure but something affecting a certain population of users.
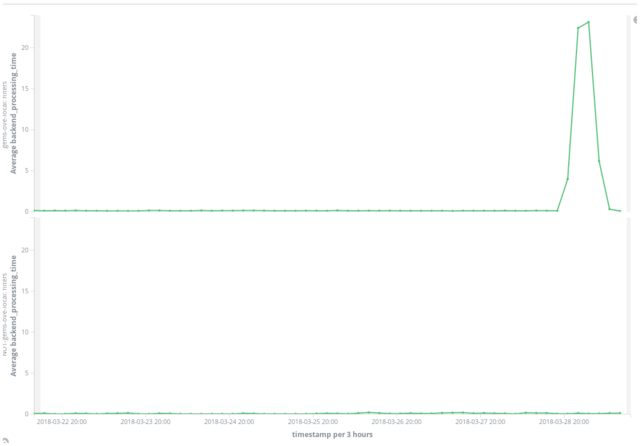
By this time we’d resolved the issued by disabling a specific remote RubyGems repository (a largely forgotten and unsupported internal one used by a handful of teams) which was found to be offline. We presumed that having that remote repository included in virtual repositories, including our master “all-gems” repository, was causing them to fail as well. To evaluate this based on data, I graphed the processing times of requests to repositories that included the problematic one, and requests to repositories that did not. The result is the proverbial “smoking gun”. The top graph shows processing time of requests to repositories including the problematic one, which increase over twenty times the baseline and shows a shape very similar to our 99th percentile. The bottom graph shows processing time of requests to repositories that do not include the problematic one, and shows no discernible difference during the outage from the previous thirty days.
Logstash Configuration File
Logstash’s configuration format has three main parts: input, filter, and output. Below you’ll find the configuration file that I used for this project and an explanation of it. I can’t take credit for most of it, but rather pieced it together under pressure from a few sources online.
input {
    s3 {
        bucket => "our-artifactory-log-bucket-name"
        region => "us-east-1"
        prefix => "elb_access_logs/AWSLogs/012345678901/elasticloadbalancing/us-east-1/2018/03"
        type   => "elb"
    }
}

filter {
   if [type] == "elb" {
      grok {
         match => ["message", "%{TIMESTAMP_ISO8601:timestamp} %{NOTSPACE:loadbalancer} %{IP:client_ip}:%{NUMBER:client_port:int} (?:%{IP:backend_ip}:%{NUMBER:backend_port:int}|-) %{NUMBER:request_processing_time:float} %{NUMBER:backend_processing_time:float} %{NUMBER:response_processing_time:float} (?:%{NUMBER:elb_status_code:int}|-) (?:%{NUMBER:backend_status_code:int}|-) %{NUMBER:received_bytes:int} %{NUMBER:sent_bytes:int} \"(?:%{WORD:verb}|-) (?:%{GREEDYDATA:request}|-) (?:HTTP/%{NUMBER:httpversion}|-( )?)\" \"%{DATA:userAgent}\"( %{NOTSPACE:ssl_cipher} %{NOTSPACE:ssl_protocol})?"]
      }
      grok {
         match => ["request", "%{URIPROTO:http_protocol}"]
      }
      if [request] != "-" {
         grok {
            match => ["request", "(?<request>[^?]*)"]
            overwrite => ["request"]
         }
      }
      useragent {
         source => "userAgent"
      }
      date {
         match => ["timestamp", "ISO8601"]
      }
   }
}

output{
    elasticsearch {
        hosts => "https://vpc-jantman-art-elb-test2-ryomklmh5hr7pcmhw7jvx7t374.us-east-1.es.amazonaws.com:443"
        ssl => true
    }
}
Input
The input section defines our data source, in this case the S3 input plugin which reads files from an S3 bucket (after reading the existing files, it polls every 60 seconds for new ones). The above example is configured to read from a bucket named “our-artifactory-log-bucket-name” in us-east-1, and read files under the elb_access_logs/AWSLogs/423319072129/elasticloadbalancing/us-east-1/2018/03 prefix. It also assigns a “type” of elb to the logs, for reference later in the configuration.
Filter
The heart and real power of Logstash is in its ability to transform data via both built-in capabilities and filter plugins. Unlike in some other tools such as Splunk, in the ELK stack all data manipulation, parsing, extraction, and filtering is generally done where events originate in Logstash rather than on the server. Events are sent to Elasticsearch as JSON documents, and Elasticsearch stores, indexes, searches, and returns those JSON documents exactly as they were sent in.
The filter we use here has a number of statements wrapped inside if [type] == "elb", which ensures that they only operate on logs from our S3 input which we assigned the “elb” type to. Let’s examine the statements within the if one by one:
grok {
    match => ["message", "%{TIMESTAMP_ISO8601:timestamp} %{NOTSPACE:loadbalancer} %{IP:client_ip}:%{NUMBER:client_port:int} (?:%{IP:backend_ip}:%{NUMBER:backend_port:int}|-) %{NUMBER:request_processing_time:float} %{NUMBER:backend_processing_time:float} %{NUMBER:response_processing_time:float} (?:%{NUMBER:elb_status_code:int}|-) (?:%{NUMBER:backend_status_code:int}|-) %{NUMBER:received_bytes:int} %{NUMBER:sent_bytes:int} \"(?:%{WORD:verb}|-) (?:%{GREEDYDATA:request}|-) (?:HTTP/%{NUMBER:httpversion}|-( )?)\" \"%{DATA:userAgent}\"( %{NOTSPACE:ssl_cipher} %{NOTSPACE:ssl_protocol})?"]
}
grok statements are one of Logstash’s most commonly used filters. They parse arbitrary text and turn it into structured data via regular expression patterns. They also have many built-in shortcuts for common patterns (i.e. NUMBER, IP, WORD, NOTSPACE, etc). The above statement applies regular expression matching to the incoming log line (message) and assigns the results to named fields in the event (timestamp, loadbalancer, client_ip, client_port, etc.). This forms the basis for our structured ELB access log, and represents the bulk of the work that Logstash does when turning the lines of our text file access logs into JSON documents suitable for Elasticsearch.
Note: A Google search should turn up grok patterns for many common log types. If you need to develop your own, https://grokdebug.herokuapp.com/ is an invaluable tool for experimentation.
grok {
    match => ["request", "%{URIPROTO:http_protocol}"]
}
In the previous grok statement we set the request field, the full URI requested from the ELB, using the GREEDYDATA pattern (.*) based on its position in the log. Here, we extract the leading protocol from the URI (http or https for Artifactory) and store it in a new http_protocol field.
if [request] != "-" {
    grok {
        match => ["request", "(?<request>[^?]*)"]
        overwrite => ["request"]
    }
}
I believe this trims the query string from request, if present.
useragent {
    source => "userAgent"
}
This runs the userAgent field of the event through Logstash’s built-in useragent filter plugin. This parses the user-agent string using BrowserScope data and, for recognized user agents, turns it into structured data including information like browser family, operating system, version, and device.
date {
    match => ["timestamp", "ISO8601"]
}
This uses the date filter to match an ISO8601-format date in the timestamp field (extracted in our first grok pattern) and use it to set the event timestamp.
Output
We have a single output configured in the example above, the built-in elasticsearch output plugin, that sends logs to our Elasticsearch instance. The only configuration it needs (following the instructions above) is the URL to our AWS Elasticsearch domain, specified in the hosts field, and indication that the cluster uses SSL. It is important to note that the hosts URL must include the :443 port specification explicitly, or else it will default to Elasticsearch’s default port of 9200. Also note that if you configure Elasticsearch with IAM Authentication enabled, you must use the logstash-output-amazon_es plugin from Amazon instead.
Comments
comments powered by Disqus