Back in March when I selected a new template for this blog, I posted that I was looking into open source self-hosted web analytics tools to replace Google Analytics. There were a few reasons for this; most importantly, it started from a discussion with some privacy-conscious coworkers, who said that they use NoScript and specifically block Google from tracking them (which also breaks Google Analytics). This was a serious issue for me, as I no longer process server-side logs but relied solely on Google Analytics for traffic information. So, I decided to try something other than Google and ended up settling on Piwik as my solution. I will say, in full disclosure, that the amount of information Piwki gives is a bit scary; I can watch users navigate this blog in realtime, and even the initial dashboard page gives a list of the most recent visitors, with their IP address, country of origin, browser, OS, and the pages they visited. However my decision was made on two main points: first, that I wanted something withich could use server-side PHP to log visits (albeit with a lot less information) of people who had JavaScript or tracking disabled, and second, that if someone is going to have such amazingly detailed information on my visitors, it should be me, so I can ensure that I’m the only person who has access to it and that it isn’t used for the wrong purposes.
Aside: The only revenue I get from this site is through Google AdSense, which isn’t a whole lot given the low traffic (certainly not enough to pay for the hosting). Other than that, I keep this blog to try and share my knowledge with others, and hope that someone else can find the solution to their problem here instead of doing the work that I did. So, I find analytics very helpful; I check my stats now and then, go back and update or add to the most popular posts, and try to write relevant posts if it seems like a lot of people are finding their way here for something slightly different than the actual post they landed on. Unfortunately, that last point isn’t as easy since Google switched to HTTPS Search for logged-in users on October 18th, 2011 - I can no longer use Piwik see the search keywords that got Google users to my site. Luckily, these are still available through Google Webmaster Tools (via Traffic -> Search Queries on the left menu), though it adds an additional step and removes some of my motivation to check regularly and make sure people are getting useful content. Also, perhaps most importantly, it doesn’t let me associate search query with other stats like time on page, so even if one search query was very popular, I have no way of knowing whether all those people actually read the page, or took one look at it and left.
I really like Piwki. I don’t use most of it terribly often, but it gives me a nice overview visits graph on the WordPress dashboard (via the WP-Piwik plugin), infinitely detailed information (most of which I haven’t even looked at) in the Piwki web interface, and nightly email reports of visits to the site. It also supports multiple sites, so I have it on my ancient wiki, my Redmine instance, and even ViewVC. I’d highly recommend it; it’s full-featured (beyond anything I can even comprehend, really)
I was recently looking through the stats for this blog, and came by some unfortunate, though not surprising, trends. Below is the graph of visits per day, from April 1, 2012 through today (August 26, 2012):
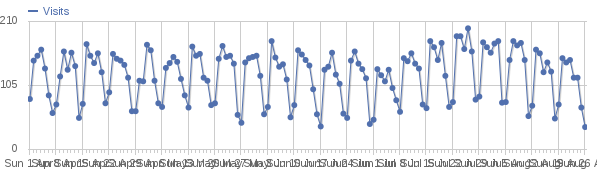
- It’s probably not terribly unusual for a site with as much technical
content as mine (and mostly professional stuff, not just for
hobbyists), my weekend traffic is usually a full 50% lower than
weekday traffic. This can also be seen in the graph of visits by
visitor’s local time, which is decidedly biased towards the 9am-5pm
window:
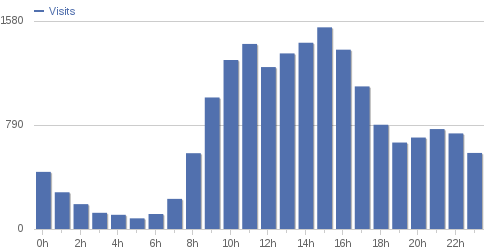
I guess there’s nothing I can really do about that, and it just gives me a nice maintenance window at 4am on Sunday mornings :) - Looking at the overall graph, there also appears to be quite a bit of oscillation of the average visits over time. It’s nothing terribly large, but at a guess, I’d attribute it to my sporadic posting.
- Though it’s not visible in these graphs, this site has an 80% bounce rate (the percent of visitors that viewed only one page and then left the site). I guess that’s also not terribly unusual for a site with mostly how-to information on a wide variety of topics.
- To add a little more information to some of the previous items, here
is the chart of my Feedburner
RSS/Atom feed, since I started using Feedburner in February. The
number of subscribers is in green, and the reach (number of people
who actually clicked through to a post) is in blue:
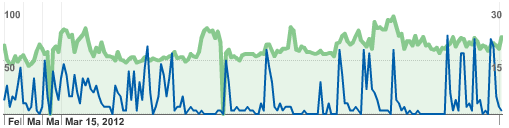
This is a clear indication of something even stronger than the “bounce rate”; the apparently high number of people who subscribe to and then unsubscribe from my feed (if these stats are accurate). To me, this is an even stronger indication that what I really need to do is post useful content on a more regular basis - I have a tendency to blog in spurts, and either start a draft and never finish it, or write a few posts and set them to “pending” status with the intent of publishing them over a few days… and then forget the last part.
Comments
comments powered by Disqus