This week I finally bought myself a new wireless access point (AP) to replace my current ones, a pair of older Ubiquiti models that have been continually in service without issue for nine years and five years, respectively. I bought another Ubiquiti, of course, but wanted to be a bit more methodical and scientific in figuring out the best placement of it in my house.
Years ago when part of my job was supporting an extremely large wireless network, we used some expensive proprietary Windows software (I’m pretty sure it was Ekahau Site Survey) for performing site surveys to determine AP location. Essentially you temporarily rig up a running AP where you propose locating one, load a floorplan of the building into the site survey software, and then walk around the area tapping on the floorplan at your current location. At each tap, the software performs some measurements through the AP (I don’t remember what the specific software we used did, but generally it’s some bandwidth measurement like iperf) and ends up plotting a (predictive, interpolated) heatmap of signal strength or data transfer speeds over the floorplan.
I wanted to do something similar for my new AP, but was rather surprised that I couldn’t find any existing F/OSS solution; only a handful of proprietary options costing anywhere from “more than I’d pay for a one-time thing” to astronomical prices, and none of them clearly with Linux support. The closest I was able to find - and I’m very thankful that I found it - was a GitHub repository from Beau Gunderson that plots a heatmap superimposed on a floorplan using a CSV file of WiFi signal strength measurements. This was enough to get me started on a similar project to automate the process.
Over a couple of afternoons I came up with a really rough tool, python-wifi-survey-heatmap to handle this. The full documentation is in the README, but the gist is that it’s a Python GUI (wxPython) and CLI application that automates the process. It’s currently Linux-only because it uses iwlib (wireless_tools) to pull wireless information and perform scans, but that could be fixed by adding collector classes for other OSes. In short you run an iperf3 server somewhere on your LAN, connect to the SSID you want to test, fire up the GUI passing it the path to an image to use as the floorplan background and the IP or hostname of the iperf3 server, and then walk around clicking the floorplan at your current location. For each click the application will draw a yellow circle and then change it to green when measurement is complete, about a minute later.
For each measurement point (location on the floorplan), the application captures:
- Current wireless statistics including quality, signal strength, and noise level (like
iwconfig). - A current scan (like
iwlist scan) of all visible networks and their signal strength/quality. - Three 10-second iperf3 measurements to the iperf server:
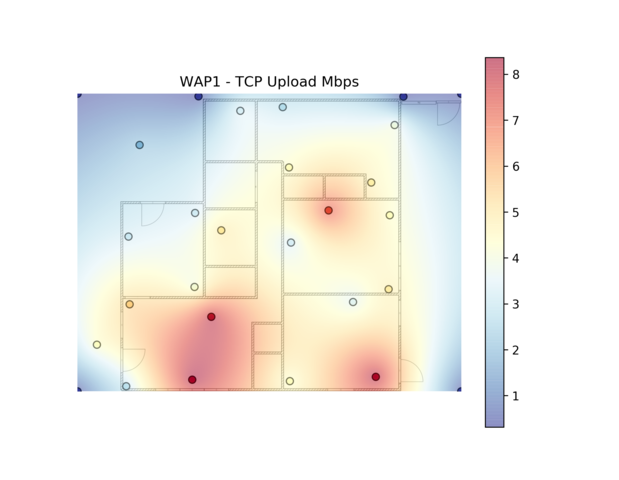
- TCP upload (client/application to server)
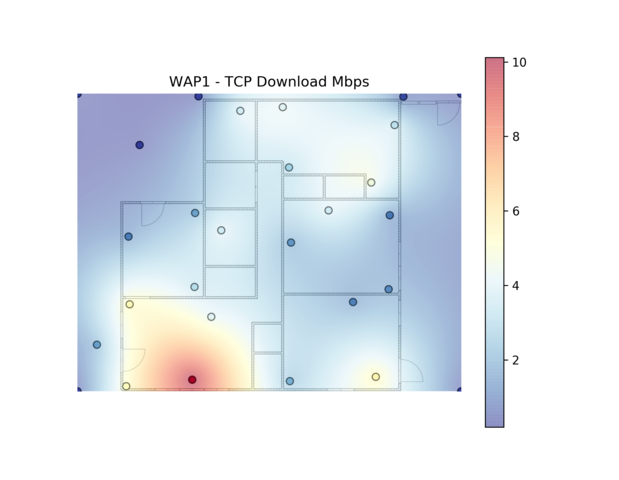
- TCP download (server to client)
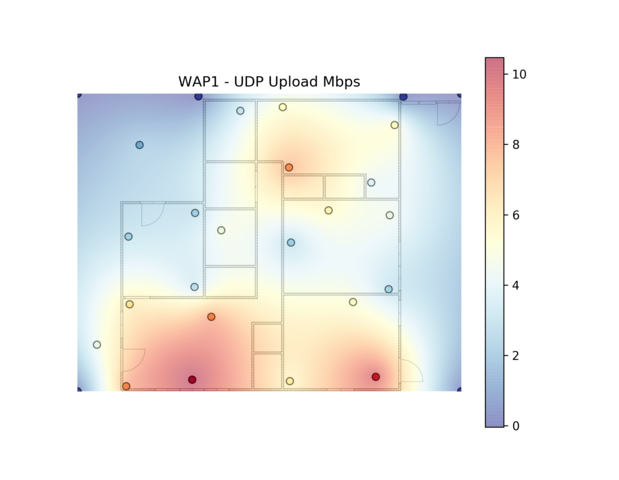
- UDP upload
After each measurement is complete all data is saved to a JSON file in the current directory, and the gui application can optionally load an existing JSON output file to continue a previous survey. None of this uses any sort of shell/subprocess/exec hackery; we interface with iwconfig and iwlist information via the python iwlib package, a cffi Python wrapper around wireless_tools’ iwlib, and with iperf3 via the iperf3 package, a cdll wrapper around libiperf.
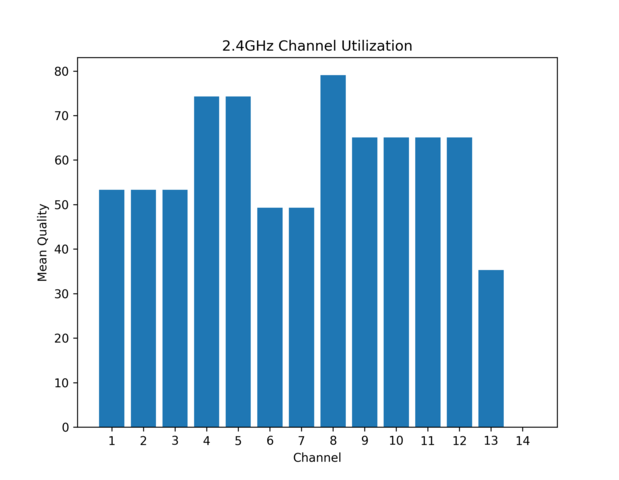
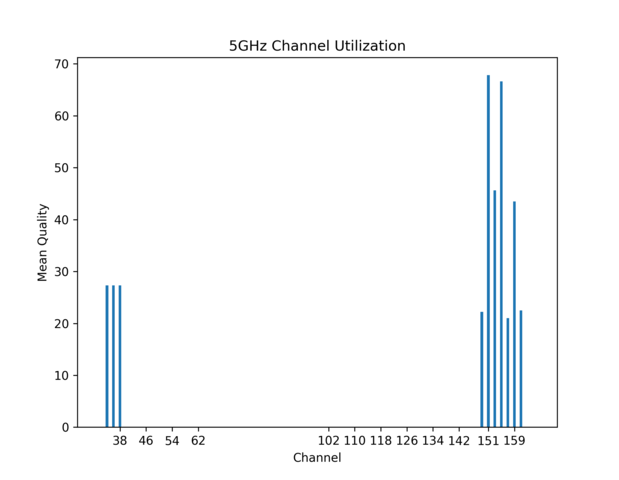
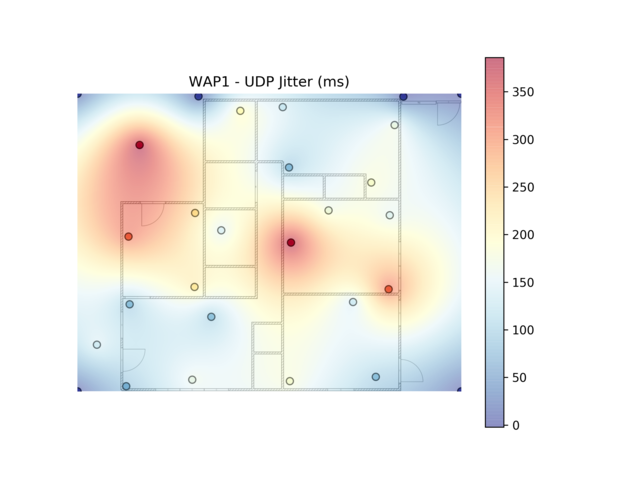
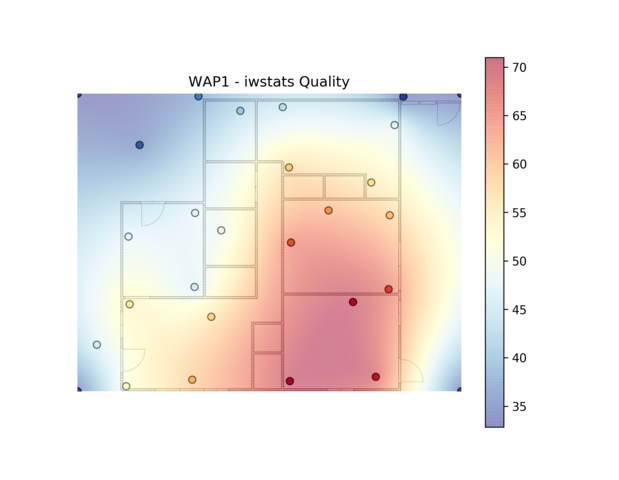
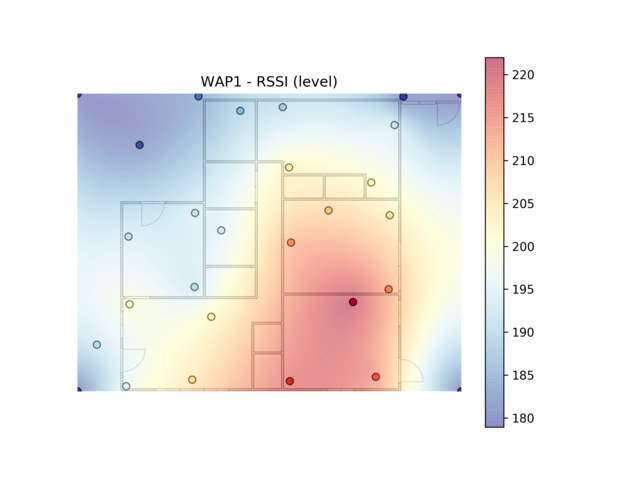
Once you’ve completed capturing data for your site survey, the wifi-heatmap CLI entrypoint processes the data and generates some heatmaps as well as channel utilization graphs like these:
All of the code and some initial documentation is available at https://github.com/jantman/python-wifi-survey-heatmap. It’s very alpha and rough around the edges, and I doubt I’ll be actively developing or supporting it once I’m done installing my new AP, but I very much hope that it might be of use to someone else and maybe someone will even improve it a bit.
Comments
comments powered by Disqus